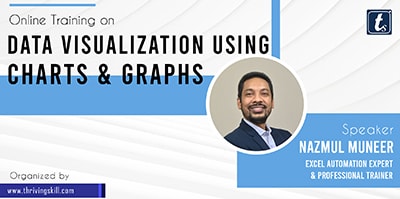
Data Visualization Using Charts & Graphs
Data Visualization Using Charts & Graphs OVERVIEW: Data visualization is very important for users who are involved with data analysis and preparing reports for decision-makers. Every individual presentation should be an individual story-teller that will present the key information of your data professionally. When you will prepare charts or graphs, you should measure which chart is appropriate for your data. For preparing a professional-looking visual presentation, you must think of a few rules that you must follow and a few rules you should avoid. Most of the time you are customizing your chart for better presentation and wasting huge times …
Curriculum
- 1 Section
- 1 Lesson
- 104 Weeks
- Data Visualization Using Charts & Graphs1
Overview
Data Visualization Using Charts & Graphs
OVERVIEW:
Data visualization is very important for users who are involved with data analysis and preparing reports for decision-makers. Every individual presentation should be an individual story-teller that will present the key information of your data professionally.
When you will prepare charts or graphs, you should measure which chart is appropriate for your data. For preparing a professional-looking visual presentation, you must think of a few rules that you must follow and a few rules you should avoid. Most of the time you are customizing your chart for better presentation and wasting huge times to make it better. In this 02 hours LIVE training session on “Data Visualization Using Charts & Graphs”, you will learn how to create a chart, how to customize charts, and how to present charts in a professional way.
CONTENTS OF THE TRAINING:
- General Charts – Bar, Column, Pie, Doughnut, Area and Line Chart
- Advanced Charts – Waterfall, Bubble, Radar, Sunburst, Treemap and Funnel Chart
- Special Chart – Speedometer Chart and Thermometer Chart
- Visualizing KPIs Using Excel’s Built-in Cool Features as Alternative without Charts
- Performing Standard Format Changes in Charts
- Customizing the Chart Elements Professionally
- Techniques to Choose Which Chart is Suitable for Your Dataset
- DO’s and DON’ts for Creating & Customizing Charts
- PRO TIPs for creating and customizing charts
Note:
- All participants will get a digital certificate from Thriving Skills Limited.
- Must set up your first name, last name, and display name from settings of your profile for your certificate.
- Don’t click on the “FINISH COURSE” button.
- If you click on the “FINISH COURSE” button then the webinar will be finished and a Certificate will be generated.
Course Instructor:
Courses of this Instructor:


